> ## Documentation Index
> Fetch the complete documentation index at: https://help.jetpack3pl.com/llms.txt
> Use this file to discover all available pages before exploring further.
# Inventory Velocity Report
> Track SKU performance with velocity metrics, sales volume analysis, and estimated days on hand to optimize your inventory replenishment strategy.
The Inventory Velocity Report gives you actionable insights into how quickly your products are moving through your fulfillment network. By analyzing sales velocity, days on hand, and top/bottom performers, you can make informed decisions about inventory replenishment, product focus, and distribution strategy.
## Report Overview
The Inventory Velocity Report refreshes once daily in the mornings (UTC). The page displays the date and time of the last refresh at the top of the report, ensuring you're always aware of the data's currency.
This report helps you understand which SKUs are selling quickly, which are moving slowly, and how long your current inventory levels will last based on historical performance.
***
## Key Metrics
The report surfaces four critical metrics to help you assess SKU performance:
| Metric | What It Measures | How It's Calculated |
| ---------------------------------- | ----------------------------------------------------------------------------------------------------------- | ------------------------------------------------------------------------------------------------------------------------------------ |
| **Total Units Sold per SKU** | The cumulative units of a particular SKU sold across all fulfillment centers within the selected time range | Excludes kitting, de-kitting, case breakdown, inventory disposal, and donation work orders, as well as restocked units |
| **Average Daily Velocity per SKU** | The average number of units sold per day for a given SKU | Total Quantity Sold ÷ Number of Days in Date Range
**Example:** 100 units sold over 7 days = 14.29 average daily velocity |
| **Estimated Days On Hand** | An estimate of how many days your current inventory will last based on average daily velocity | Current Inventory On Hand ÷ Average Daily Velocity |
| **Top 5 and Bottom 5 SKUs** | Quick insights into your highest and lowest performing SKUs by sales volume | Ranked by Total Units Sold within the selected time range |
These metrics provide the foundation for strategic inventory decisions. If your Estimated Days On Hand is decreasing rapidly, it's time to [create a WRO](/fulfillment/sending-inventory/creating-wro) to replenish stock. If certain SKUs consistently appear in your Bottom 5, consider adjusting your [replenishment schedule](/fulfillment/sending-inventory/managing-replenishment-schedules) or evaluating product positioning.
***
## Available Sub-Reports
The Inventory Velocity Report page provides four specialized views to analyze your data from different angles.
### SKU Performance by FC
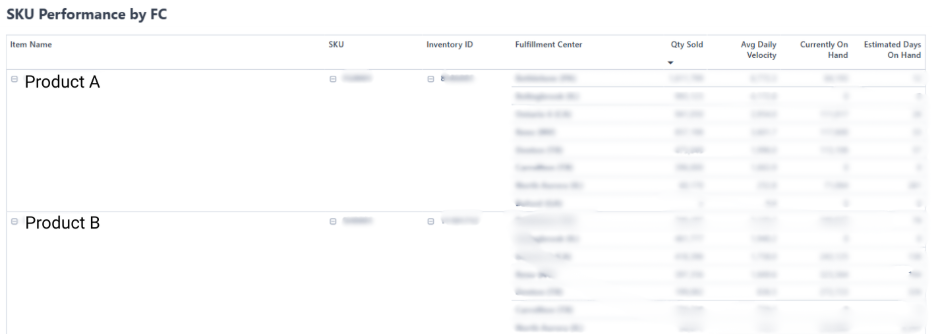
This sub-report breaks down performance data by SKU across different fulfillment centers, allowing you to see which locations are moving inventory fastest.
**Columns included:**
* Product, SKU, Inventory ID
* Fulfillment Center
* Quantity Sold (total units sold from all centers, including units assigned to orders but not yet picked)
* Average Daily Velocity
* Currently On Hand (reflecting available units as shown on the [Inventory Status page](/fulfillment/managing-inventory/inventory-status-page))
* Estimated Days On Hand
 **Notes for SKU Performance by FC:**
**Collapse Fulfillment Center Breakdown:** Click the **–** icon to the left of the product name to hide the breakdown by fulfillment center and view SKU performance aggregated across all fulfillment centers.
**Notes for SKU Performance by FC:**
**Collapse Fulfillment Center Breakdown:** Click the **–** icon to the left of the product name to hide the breakdown by fulfillment center and view SKU performance aggregated across all fulfillment centers.
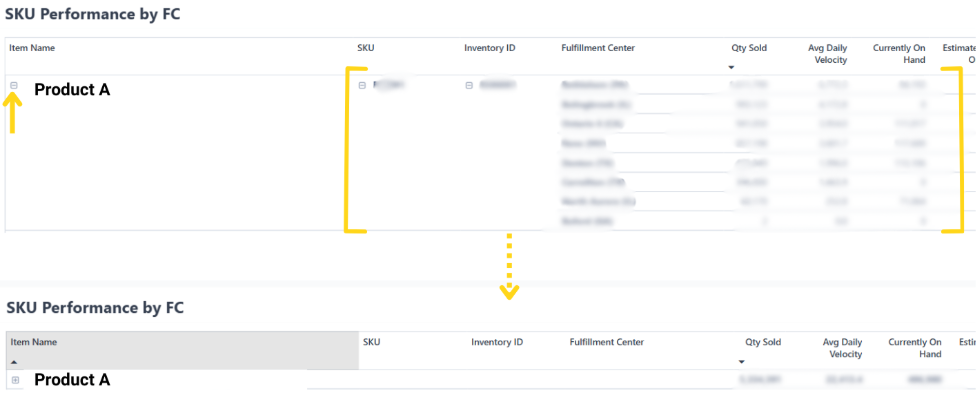 **Drill Up to Product Summary:** Click the **up arrow** icon (Drill Up) to view a summary of SKU performance rolled up by product. This is useful when you have multiple variants and want to see overall product family performance.
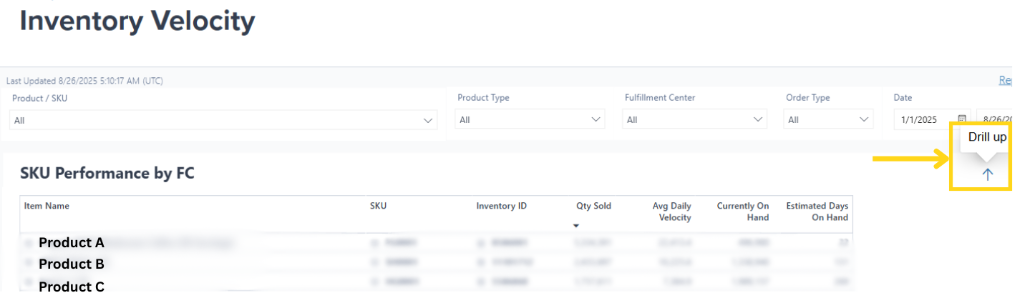 **Drill Down to Detail View:** Click the **down arrows** icon to revert back to the detailed chart view with fulfillment center breakdown.
 ### Top 5 SKUs
This sub-report identifies which SKUs have the highest sales volumes over the selected time range. Use this to understand your star performers and ensure these products remain well-stocked across your network.
### Bottom 5 SKUs
This sub-report identifies which SKUs have the lowest sales volumes over the selected time range. These insights can help you evaluate whether slow-moving inventory needs promotional support, reduced stock levels, or discontinuation.
### Top 5 SKUs
This sub-report identifies which SKUs have the highest sales volumes over the selected time range. Use this to understand your star performers and ensure these products remain well-stocked across your network.
### Bottom 5 SKUs
This sub-report identifies which SKUs have the lowest sales volumes over the selected time range. These insights can help you evaluate whether slow-moving inventory needs promotional support, reduced stock levels, or discontinuation.
 ### Units Sold
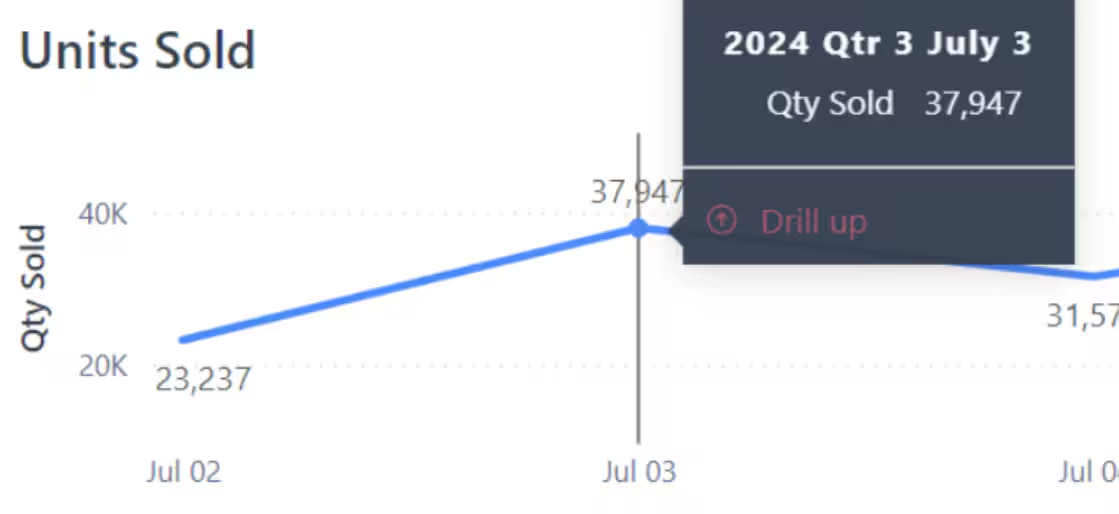
This sub-report displays the total units sold for all products across all fulfillment centers. It features a trend visual that can be drilled down or up by day, month, quarter, or year.
Hover over the line on the chart to see specific data points and gain additional insights into sales patterns over time.
### Units Sold
This sub-report displays the total units sold for all products across all fulfillment centers. It features a trend visual that can be drilled down or up by day, month, quarter, or year.
Hover over the line on the chart to see specific data points and gain additional insights into sales patterns over time.
 ***
## Filtering the Report
You can refine the data across all sub-reports using multiple filters. Filters apply to all sub-reports simultaneously, allowing you to focus on specific products, locations, or time periods.
### Product/SKU
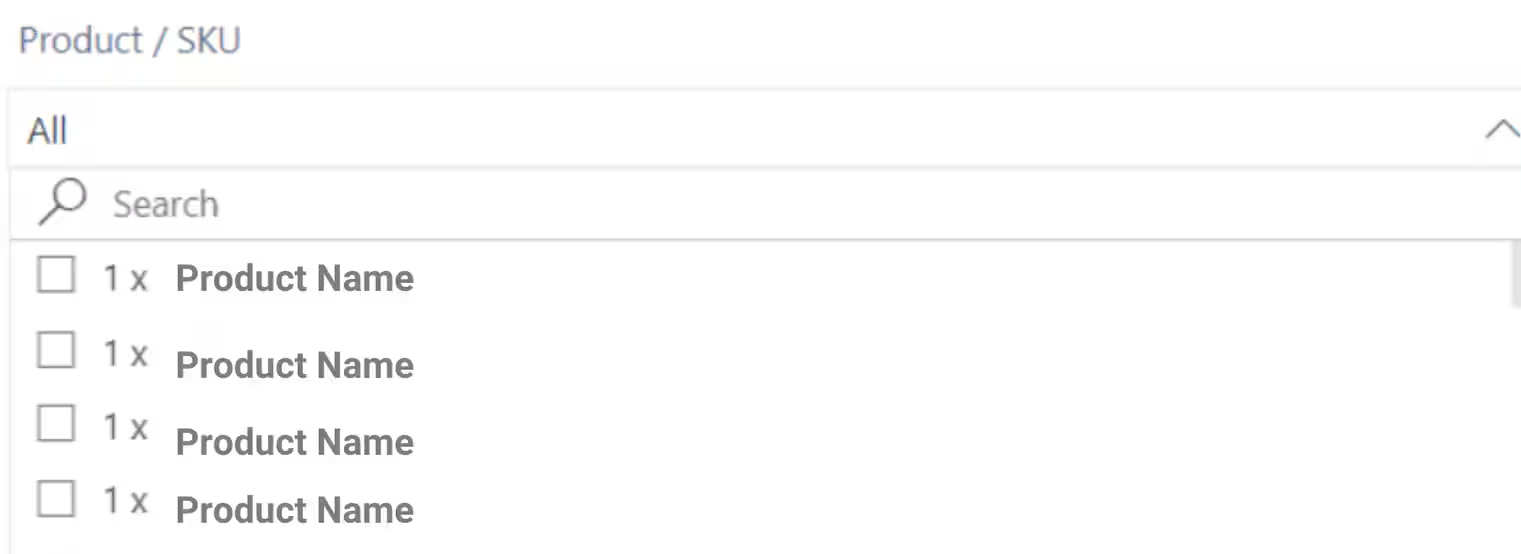
Select specific products to analyze using the dropdown or search bar. By default, all products are shown.
***
## Filtering the Report
You can refine the data across all sub-reports using multiple filters. Filters apply to all sub-reports simultaneously, allowing you to focus on specific products, locations, or time periods.
### Product/SKU
Select specific products to analyze using the dropdown or search bar. By default, all products are shown.
 ### Product Type
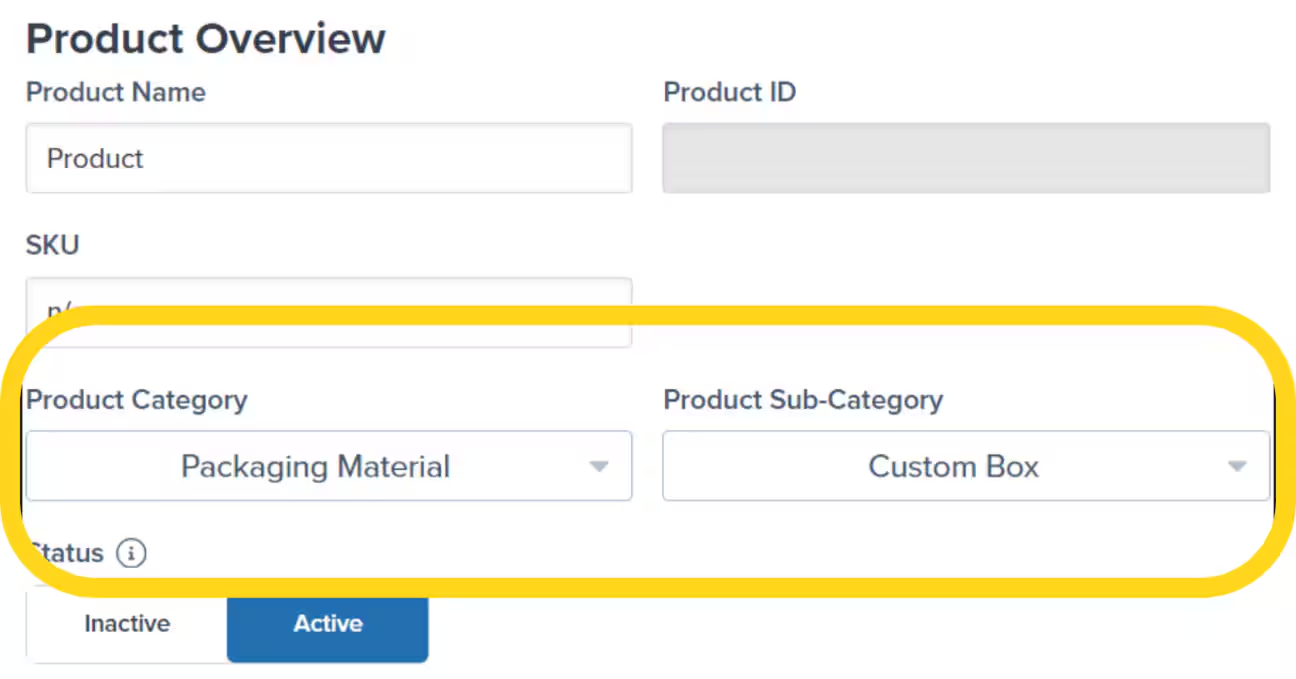
Filter by product category. Choose between:
* **Products:** Standard inventory items
* **Packaging Material:** SKUs with a Product Category of Packaging Material
### Product Type
Filter by product category. Choose between:
* **Products:** Standard inventory items
* **Packaging Material:** SKUs with a Product Category of Packaging Material
 ### Fulfillment Center
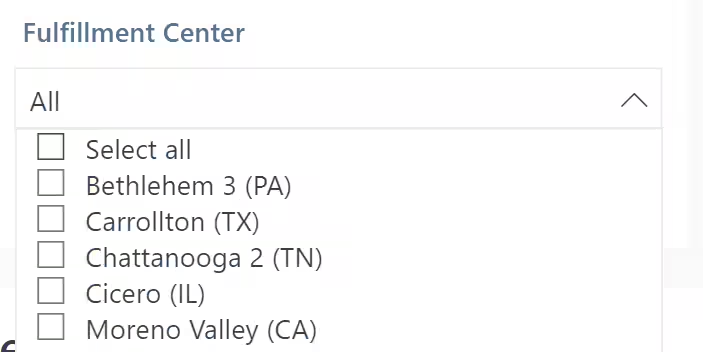
Use the dropdown to select from fulfillment centers you have access to in your Jetpack dashboard. This allows you to include only specific fulfillment centers in your analysis.
### Fulfillment Center
Use the dropdown to select from fulfillment centers you have access to in your Jetpack dashboard. This allows you to include only specific fulfillment centers in your analysis.
 ### Order Type
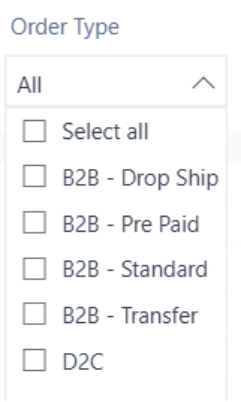
Filter by order category. Select one or more:
* All order types (default)
* B2B - Drop Ship
* B2B - Prepaid
* B2B - Standard
* B2B - Transfer
* D2C
### Order Type
Filter by order category. Select one or more:
* All order types (default)
* B2B - Drop Ship
* B2B - Prepaid
* B2B - Standard
* B2B - Transfer
* D2C
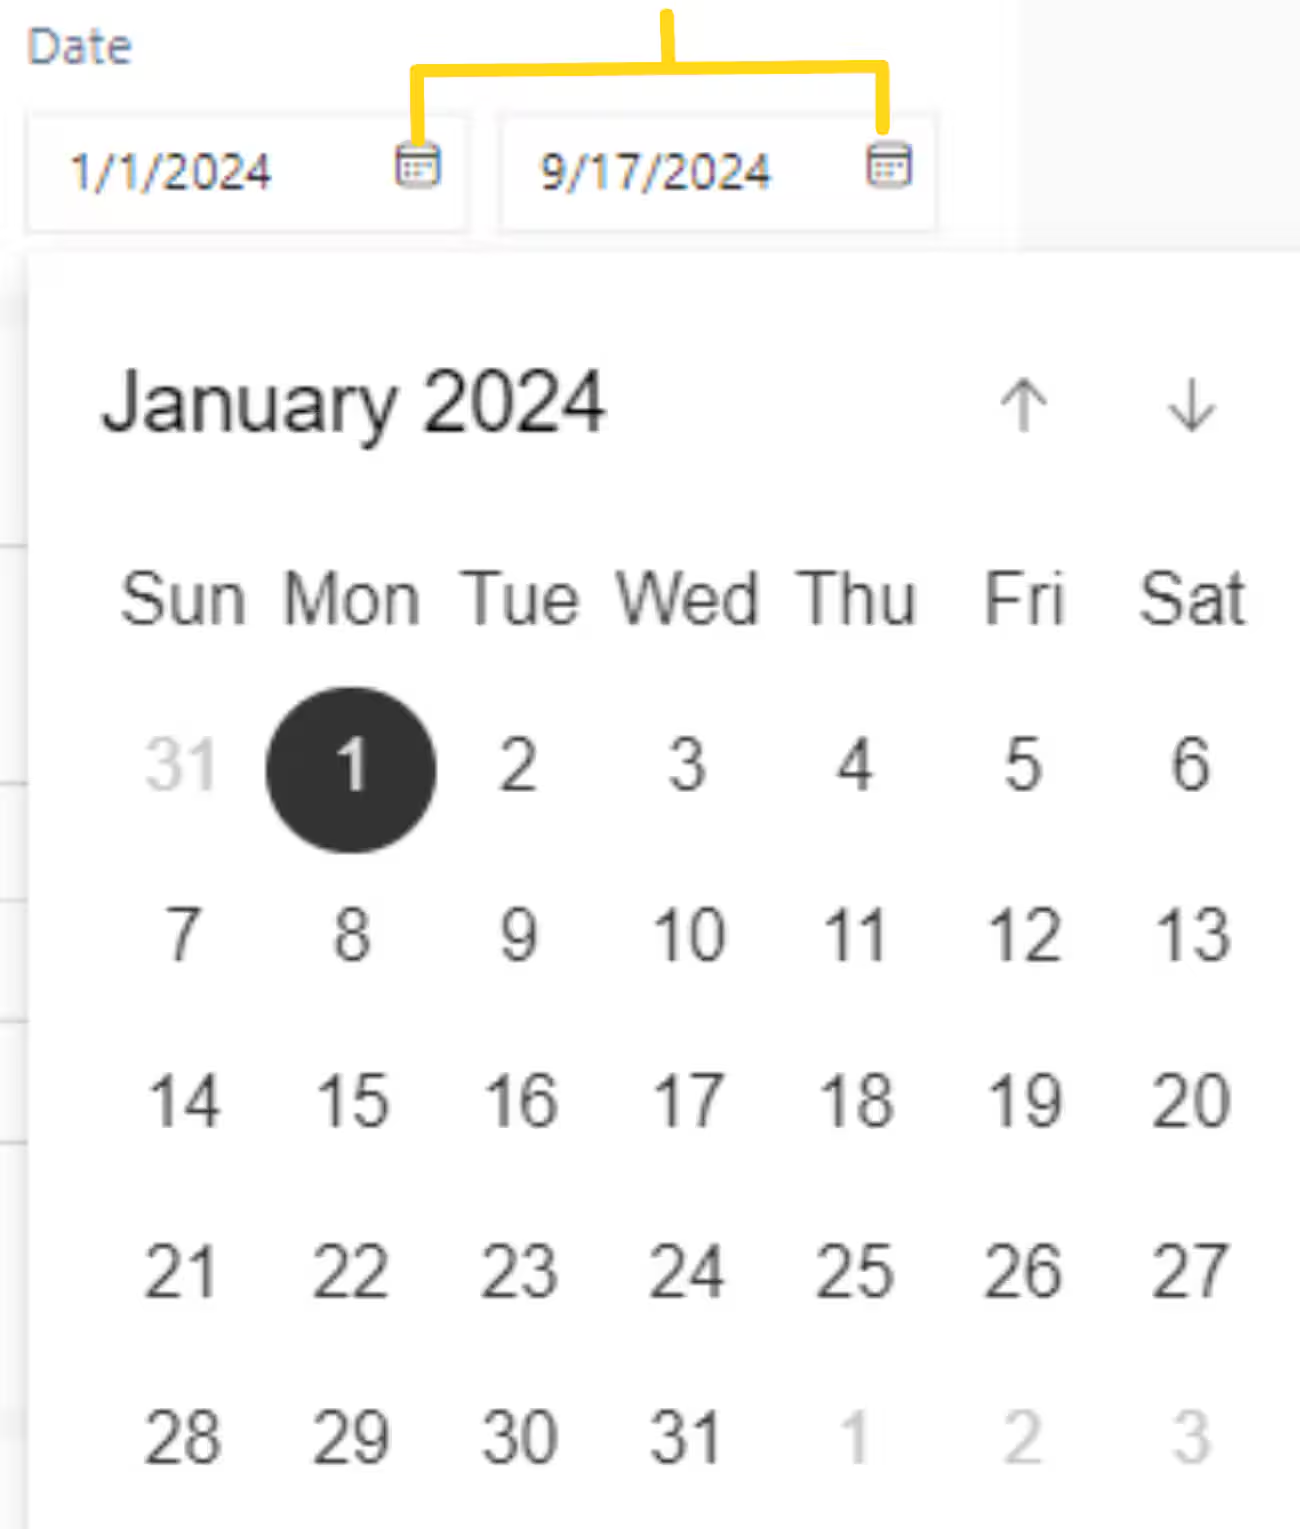
 ### Date
Define the time range for analysis:
* Select a date range using the calendar icons
* Access up to the last 12 months of data
* **Note:** Data for the current day is not available until the next refresh
### Date
Define the time range for analysis:
* Select a date range using the calendar icons
* Access up to the last 12 months of data
* **Note:** Data for the current day is not available until the next refresh
 ### Reset Filters
Click the **eraser icon** next to each filter to reset your selections to the default.
### Reset Filters
Click the **eraser icon** next to each filter to reset your selections to the default.
 ### Filtering Your Data
Choose the products, fulfillment centers, order types, and date range you want to analyze. Filters apply to all sub-reports on the page.
All sub-reports will automatically refresh to reflect your filter selections. The metrics and charts will update based on your criteria.
Click the eraser icon next to any filter to return it to the default setting, or reset multiple filters to start fresh.
***
## Exporting Reports
Each sub-report can be exported for further analysis in spreadsheet software or for sharing with your team.
Hover over the desired sub-report (SKU Performance by FC, Top 5 SKUs, Bottom 5 SKUs, or Units Sold).
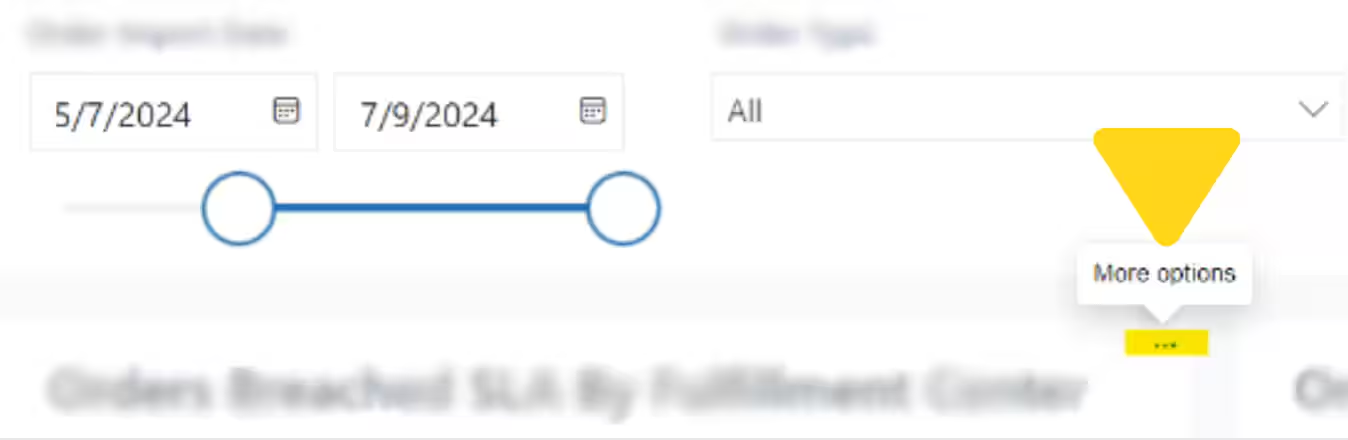
Click the **three horizontal dots** in the upper-right corner of the sub-report.
### Filtering Your Data
Choose the products, fulfillment centers, order types, and date range you want to analyze. Filters apply to all sub-reports on the page.
All sub-reports will automatically refresh to reflect your filter selections. The metrics and charts will update based on your criteria.
Click the eraser icon next to any filter to return it to the default setting, or reset multiple filters to start fresh.
***
## Exporting Reports
Each sub-report can be exported for further analysis in spreadsheet software or for sharing with your team.
Hover over the desired sub-report (SKU Performance by FC, Top 5 SKUs, Bottom 5 SKUs, or Units Sold).
Click the **three horizontal dots** in the upper-right corner of the sub-report.
 Choose **Export data** from the additional menu options. In the pop-up window, select your preferred export format:
* **Data with current layout:** Exports the data exactly as displayed in the report
* **Summarized data:** Exports aggregated or rolled-up data
Choose **Export data** from the additional menu options. In the pop-up window, select your preferred export format:
* **Data with current layout:** Exports the data exactly as displayed in the report
* **Summarized data:** Exports aggregated or rolled-up data
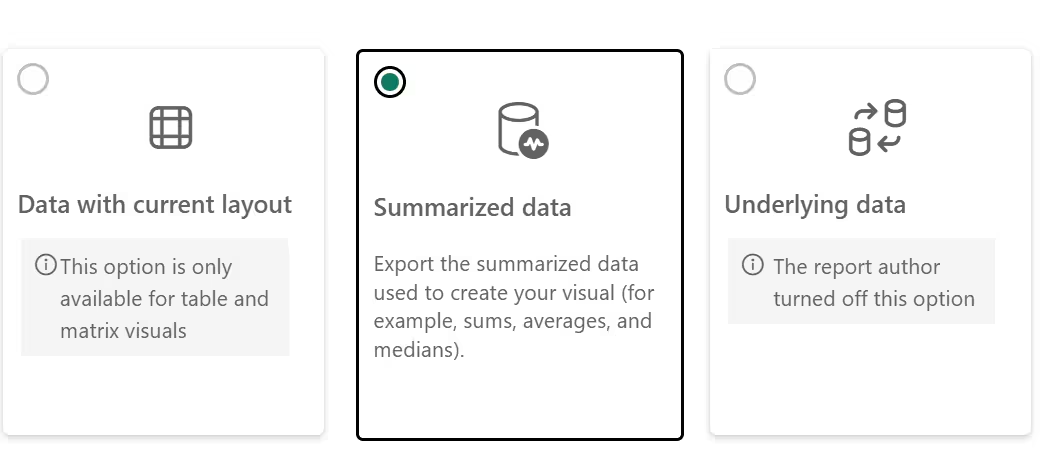 Some export options may be disabled or incompatible with certain sub-reports depending on the data structure.
Click the **Export** button. A progress bar will appear, and once completed, the file will automatically download to your computer.
***
## Let's Dive Deeper
Overview of all available reports and analytics tools
View current inventory levels and distribution across fulfillment centers
Monitor reorder points and replenishment recommendations
Identify out-of-stock SKUs with pending orders
Use velocity insights to optimize your replenishment strategy
Create warehouse receiving orders to replenish stock
Some export options may be disabled or incompatible with certain sub-reports depending on the data structure.
Click the **Export** button. A progress bar will appear, and once completed, the file will automatically download to your computer.
***
## Let's Dive Deeper
Overview of all available reports and analytics tools
View current inventory levels and distribution across fulfillment centers
Monitor reorder points and replenishment recommendations
Identify out-of-stock SKUs with pending orders
Use velocity insights to optimize your replenishment strategy
Create warehouse receiving orders to replenish stock

Questions? Contact Jetpack Care.
If you have any questions or run into issues, you can always contact Jetpack Care for help. Our team is always here to assist via Slack, phone, or email!